The internet is ubiquitous. More and more of the technology that we use in our day to day lives is becoming integrated with the IoT (Internet of Things), meaning an increasing amount of data and information can be created, stored and analyzed with decreasing human interaction.
On average, Google now processes more than 99,000 searches EVERY second (8.5 billion searches per day)! There is a mountain of data out there waiting to be put to work for YOU. Today I will show you a quick way to use that data to help you refine your marketing strategy.
First things first: you need to know where the traffic on your website is coming from. There is no sense in wasting time and money with a shot in the dark when the information you need is readily available. Marketing and advertising have changed along with the advancements in technology, but finding your Primary Markets (your main clients and those you seek to attract), should be your main focus.
Google Analytics is a powerful, free, data analysis tool that gives access and insight as to what is happening behind the scenes of every Google search that ends at your website.
You just need to know where and how to look. All of Vortex Business Solutions’ Clients receive a Google Analytics report every Monday.
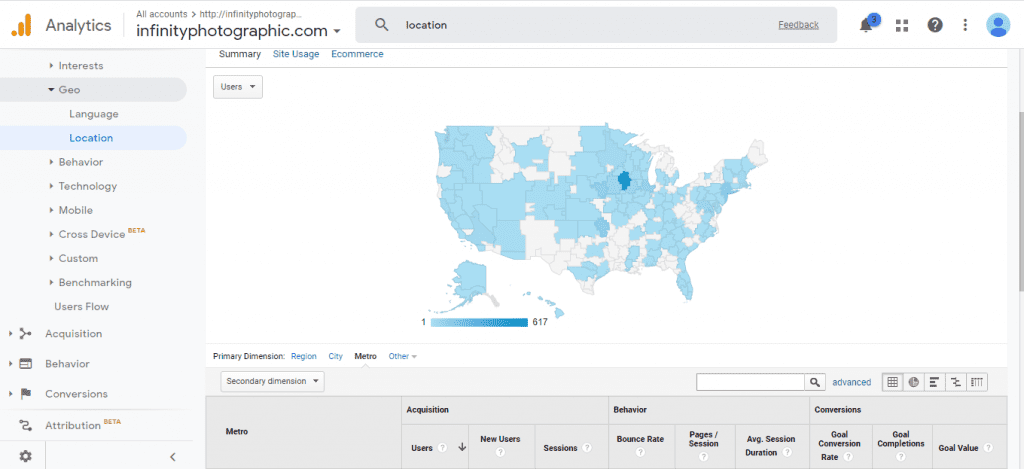
Open Google Analytics and navigate to the Geography tab and then the location section; I can see where your visits are coming from overlaid onto a map of the World. I drilled the map down to the U.S specifically by selecting Metro as the primary dimension. By hovering over each state/location you can see the number of users that Google counted from that specific area.

By clicking on the map, you can focus on increasingly specific locations.
Stay tuned to next week’s post for a drilled-down, real-world example for using Google Analytics in conjunction with a digital Marketing Campaign.


